Manhattan Analysis
Package Delivery using Truck and Drones in Manhattan
Plotting UPS Store Locations
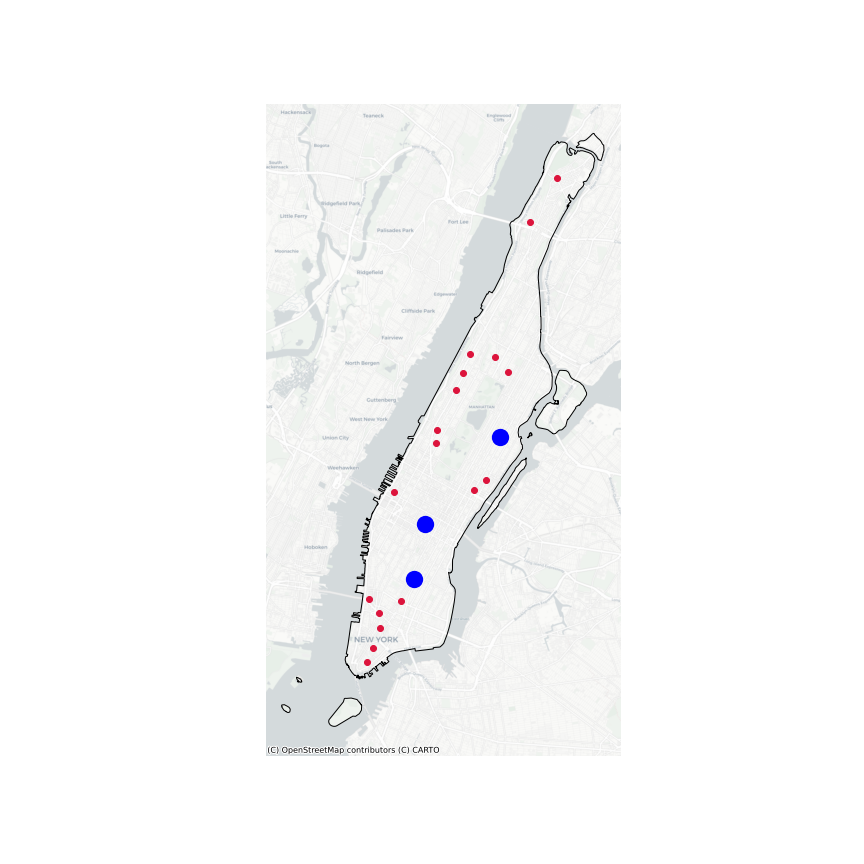
We started with plotting ‘UPS-Stores’ and “UPS Customer Center Facility” on Manhattan Map. These facilities serve as access points for UPS trucks to pick-up orders that are to be delivered.
UPS Stores and UPS Customer Center Facilities in Manhattan
DBSCAN Un-supervised Clustering Analysis
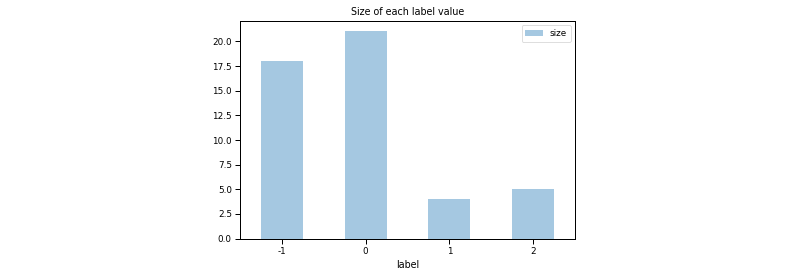
There were 48 UPS customer center and UPS store facilities in the Manhattan Area, of which we assume that not all facilities would provide delivery service since they are located in close proximities. We used DBSCAN and unsupervised clustering algorithm to determine 3 clusters for further analysis. Each cluster has a varying number of UPS stores with figures 04, 05, and 21 UPS stores clustered for a particular label. The fourth cluster was chosen from noise samples to account for UPS Stores at farther locations.
The following graph shows the number of UPS points clustered under each label. Label(-1) is noise.
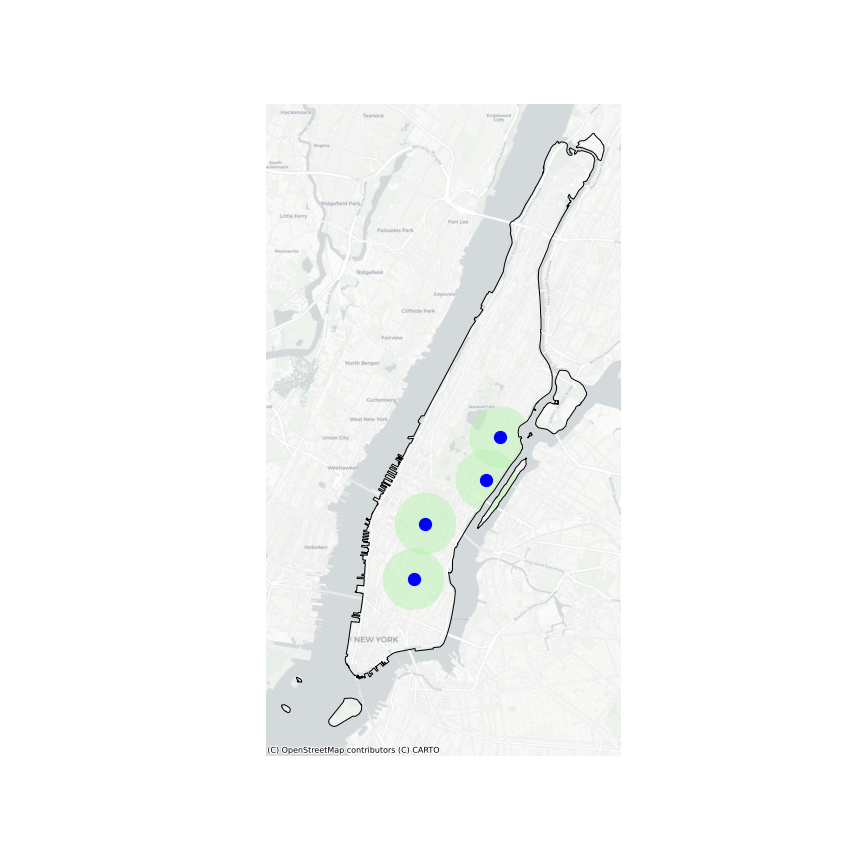
Buffer radius of 1.5km from each facility:
The urban area of Manhattan is categorized into zones (buffer radii or optimized polygon) for each UPS store. The radii for each buffer is determined to ensure minimum overlap. Each buffer zone serves as a bounding radius for the maximum travel path of trucks and drones.
Origin Point and Destination Point
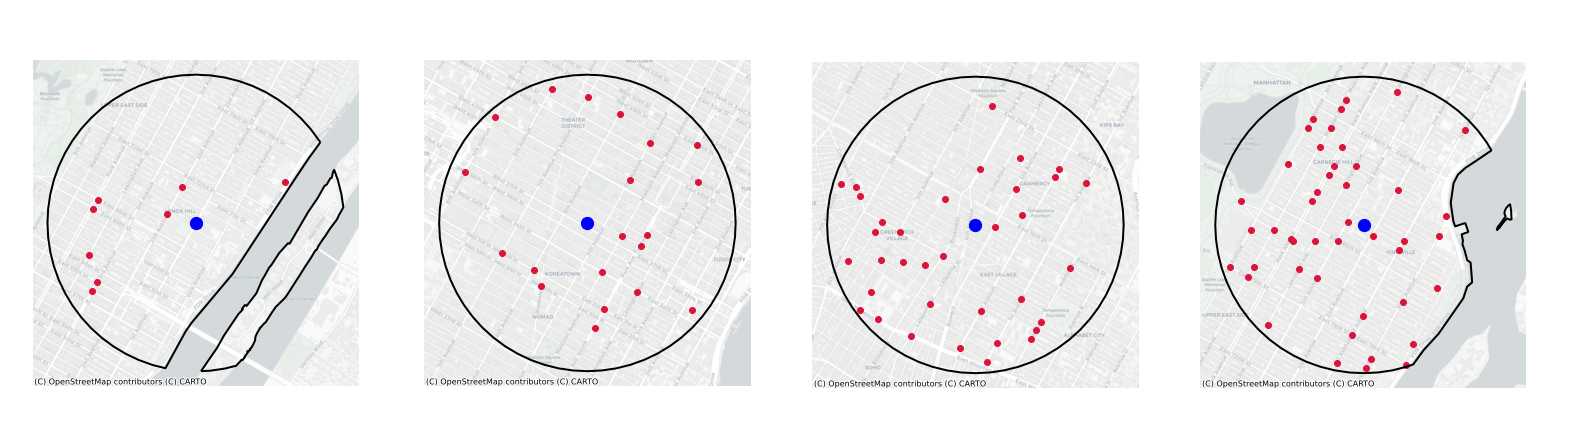
The origin point is located at the center of the buffer polygon. The nearest open-street-map(OSM) node is also calculated The number of destination points in each zone are determined based on the size of the clusters and therefore the density of the neighborhood. For example, the noise cluster is assumed to have the least number of destination points while the cluster with size 21 is assumed to have most destination points.
Delivery recipients in cluster-zones
Selection of a number of sample points (8, 20, 35 and 45) respectively was based on the machine learning clusters. These points can always be increased incrementally.
Mapping Drone Paths:
Here a straight line path is plotted assuming drones would fly over the buildings to its destination point.
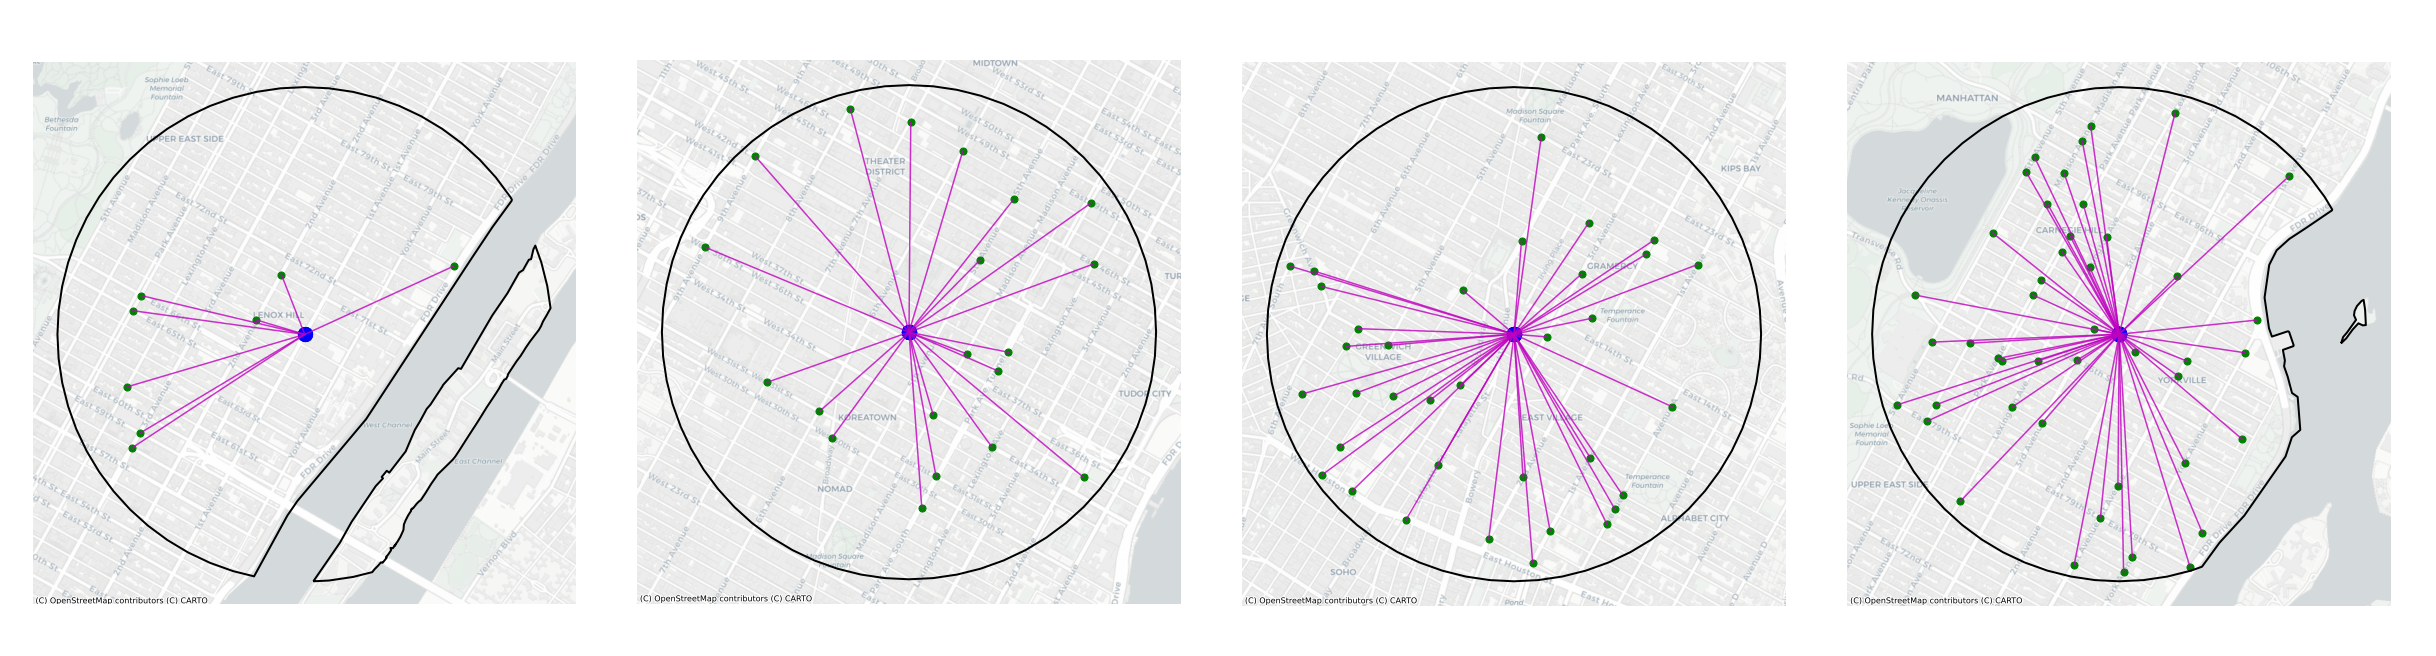 From the above analysis, total emissions for drones will be calculated based on operational carbon emissions.
Mapping UPS Truck Paths:
Mapping one continous route from origin point (UPS facility) through the random samples (delivery recipients) and looping back to start point.
Truck path for 8 delivery locations
Truck path for 20 delivery locations
Truck path for 35 delivery locations
Truck path for 45 delivery locations
From the above analysis, we calculated the Vehicle Miles Traveled and associated CO2 Emissions for Trucks.
The calculated results can be found here