Yonkers County Analysis
Package Delivery using Truck and Drones in Yonkers County
Plotting UPS Store Locations
We started with plotting ‘UPS-Stores’ and “UPS Customer Center Facility” on Manhattan Map. These facilities serve as access points for UPS trucks to pick-up orders that are to be delivered.
UPS Stores and UPS Customer Center Facility in Yonkers County
Buffer radius of 4km from each facility:
The suburban area of Yonkers County is categorized into zones (buffer radii or optimized polygon) for each UPS store. The radii for each buffer is determined to ensure minimum overlap. Each buffer zone serves as a bounding radius for the maximum travel path of trucks and drones.
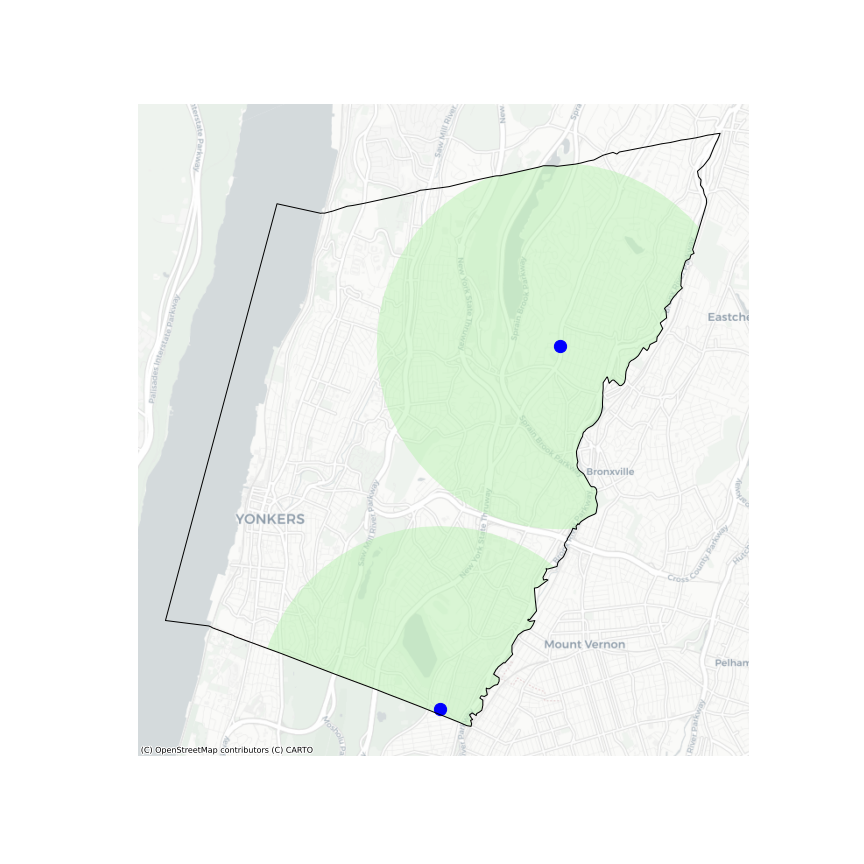
Origin Point and Destination Point
The origin point is located at the center of the buffer polygon. The nearest open-street-map(OSM) node is also calculated The number of destination points in each zone are determined based on the size of the clusters and therefore the density of the neighborhood. For example, the noise cluster is assumed to have the least number of destination points while the cluster with size 24 is assumed to have most destination points.
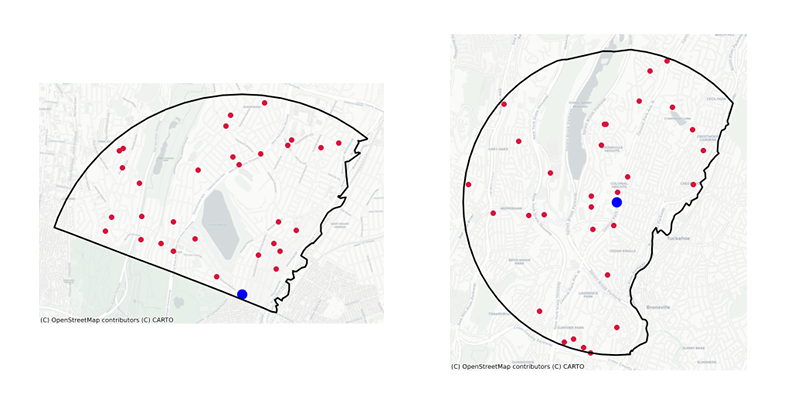
Delivery recipients in cluster-zones
Selection of a number of destination points of 30 and 45 respectively was based on the machine learning clusters. These points can always be increased incrementally.
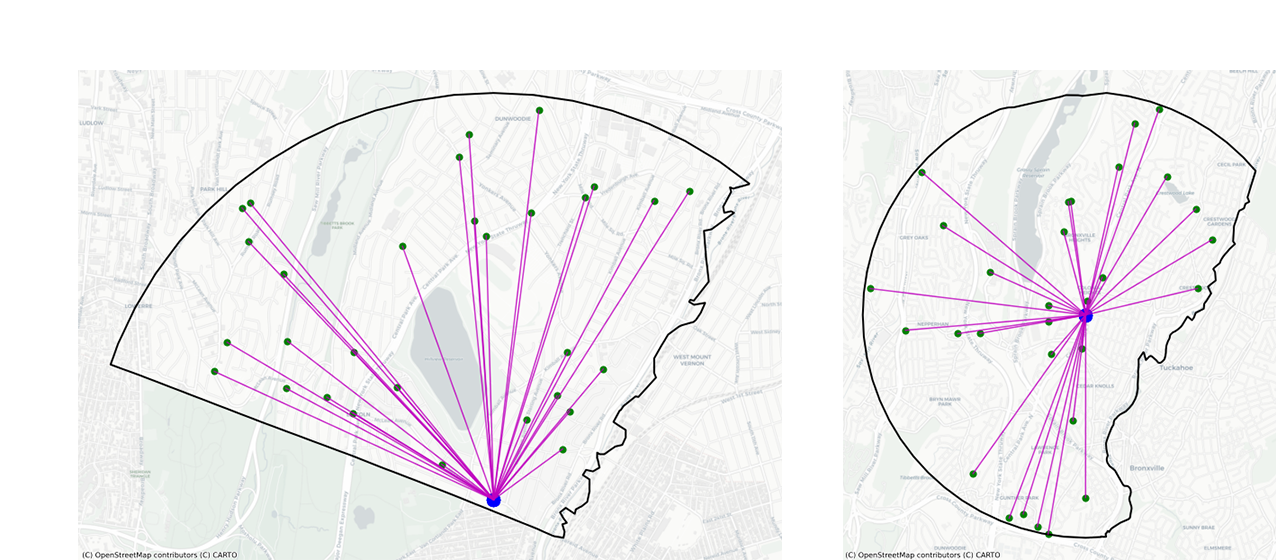
Mapping Drone Paths:
Here a straight line path is plotted assuming drones would fly over the buildings to its destination point.
From the above analysis, total emissions for drones will be calculated based on operational carbon emissions.
Mapping UPS Truck Paths:
Mapping one continous route from origin point (UPS facility) through the random samples (delivery recipients) and looping back to start point.
Cluster-zone-01:
Cluster-zone-02:
With the help of the above analysis, total emissions for drones will be calculated based on operational carbon emissions.
The calculated results can be found here